Results Menu
Pathfinder services can generate multiple analysis deliverables based on the parameters set in the project, providing information about the optimal location and route of the infrastructure.
Typically, the results are generated in sequence, since each one is needed to calculate the next one.
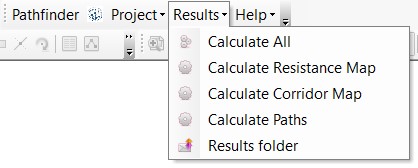
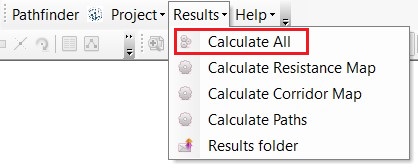
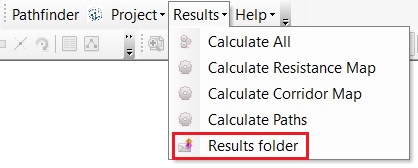
To run the generation processes and access the available results, use the Results menu in the Pathfinder toolbar.
Calculate Resistance Map
The first result to be calculated is the Resistance Map (RM), which combines the resistance values of the layers in the project.
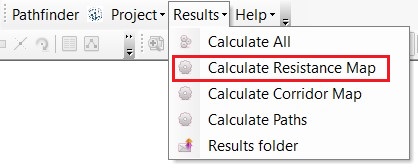
To generate the RM, click on the Calculate Resistance Map menu option.
In addition to the standard method, which adds all the resistance values, there might be other combination methods available in your license for specific purposes.
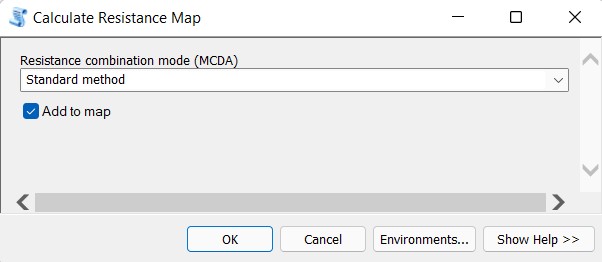
If the Add to map option is checked, the RM will be added to the map document as a raster layer after the process is finished. In any case, the corresponding raster file is saved to the results folder in the same location as your ArcMap document.
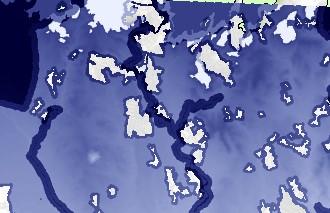
Areas with Forbidden values (-999) or outside the project area will look transparent. Larger values in this raster mean a higher resistance. As with any raster layer, the symbology can be changed to use your prefered color ramp or display specific value ranges.
Calculate Corridor Map
The Corridor Map provides a summary of all possible paths from the Start to the End point which have an accumulated resistance near the optimum, so in addition to hinting where this optimum will be located, it also shows possible alternative routes.
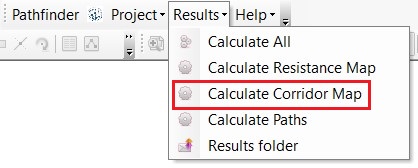
As with the Resistance Map, go to the Results menu in the Pathfinder toolbar and click on the Calculate Corridor Map option.
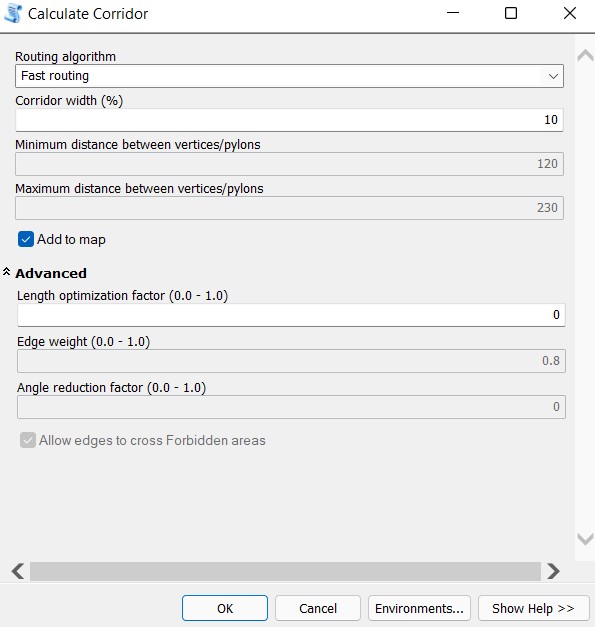
The area covered by the corridor map is defined by a percentage value, the width of the corridor, which can be set by the user. This percentage value indicates how much above the minimum path resistance is be included in the corridor. As an example, if the resistance along the optimal path is 1200 and the corridor width is 10%, the corridor map will show areas containing paths with a resistance lower than 1200 + 10% of 1200 = 1320.
Depending on the routing algorithm selected, additional options will be available.
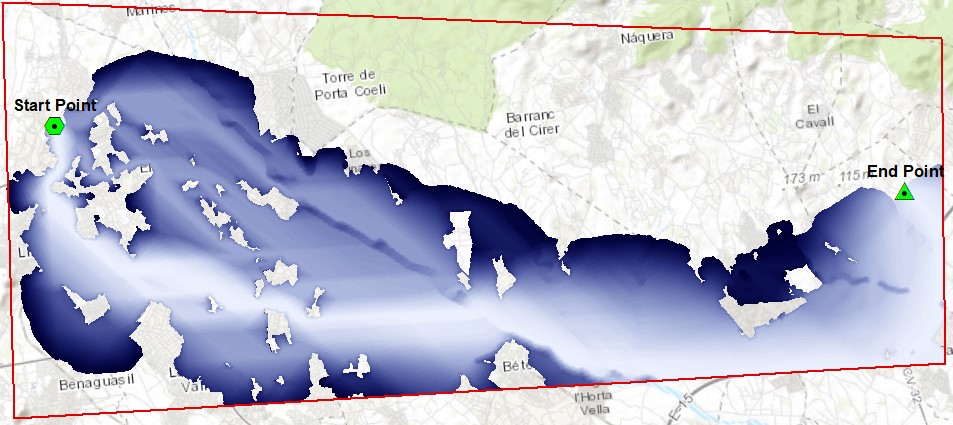
After the calculation process is completed, the corridor map will be displayed in the Map view.
By default, lighter colors in the corridor mean lower resistance (near the optimal) and darker colors mean higher resistance. Areas with a resistance higher than the threshold corresponding to the width are shown as transparent. As with the RM, the user can change the color palette using the ArcMap symbology options.
Note
You might get a failure message if the Start or End points of the project are located in an area with “Forbidden” resistance.
Calculate Path(s)
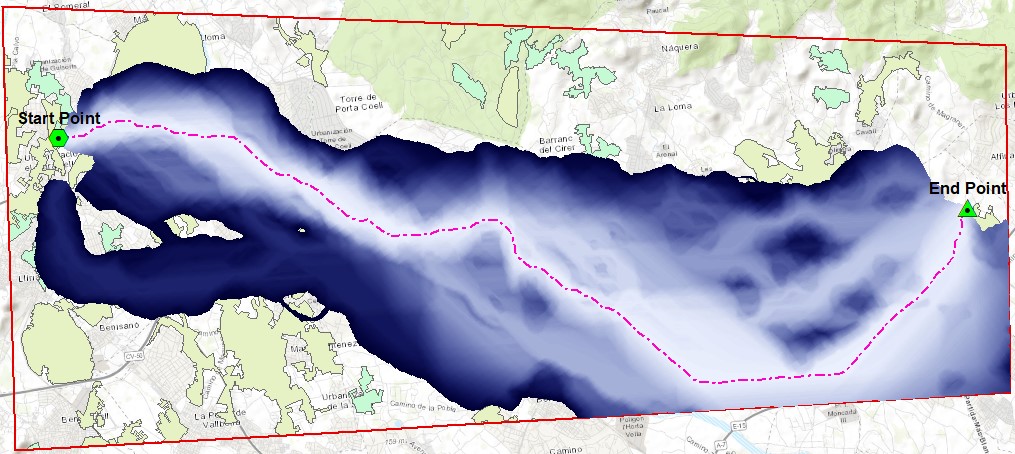
The final goal of Pathfinder is to find the optimum routes for a linear infrastructure between the Start and End points.
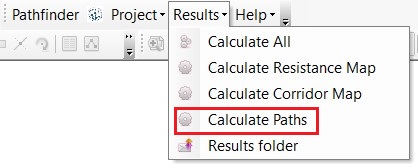
To run this calculation, click in the Calculate Paths option in the Results menu.
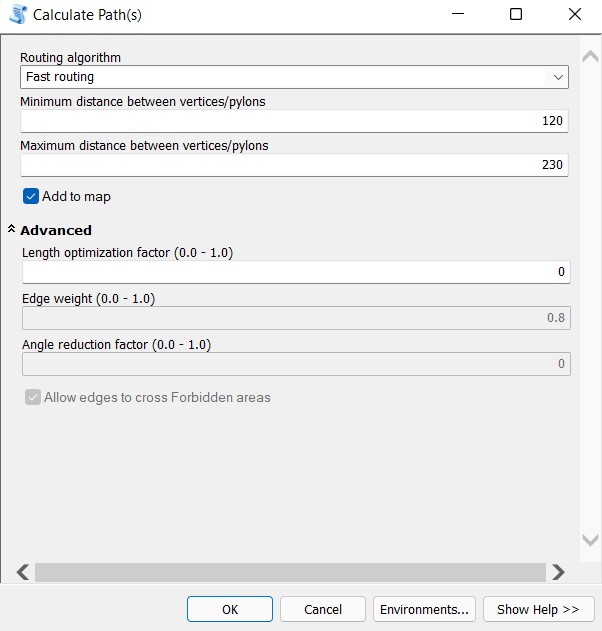
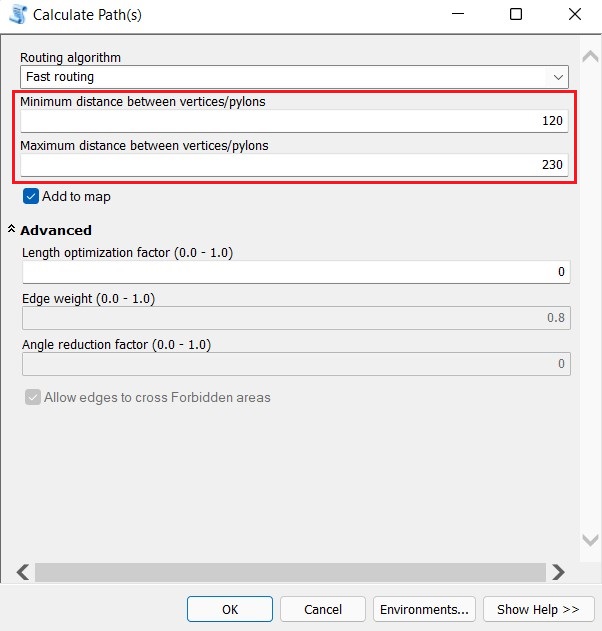
Pathfinder offers a default Fast routing algorithm to perform this calculation. Depending on your company license, you may also have access to other algorithms. In the Calculate Paths tool, it is possible to choose the one you prefer.
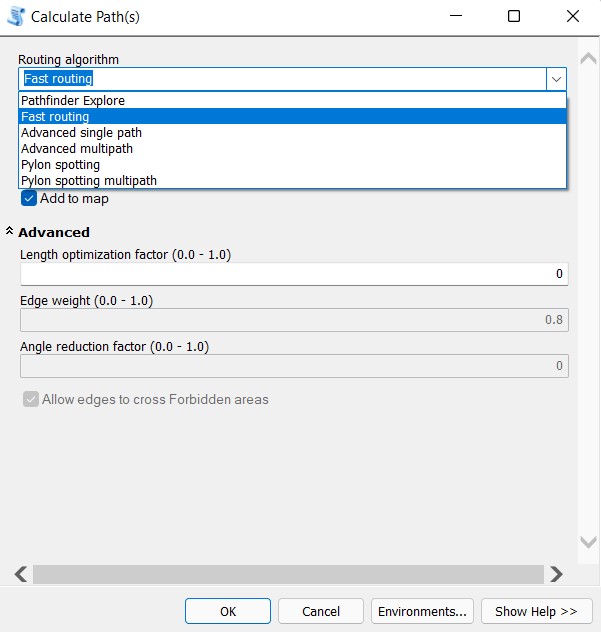
Fast Single Path: this is the fastest to compute. It generates a single optimal path by finding the least resistance route in the corridor map, crossing the lightest areas.
Pylon spotting: it optimizes the pylon/tower locations and angles for electricity transmission applications. Additional parameters let the user control the relative importance of resistance along the line (versus the resistance at the pylon locations) and the minimization of the angles.
Because of the additional resources required to run this algorithm, it may take longer to finish.
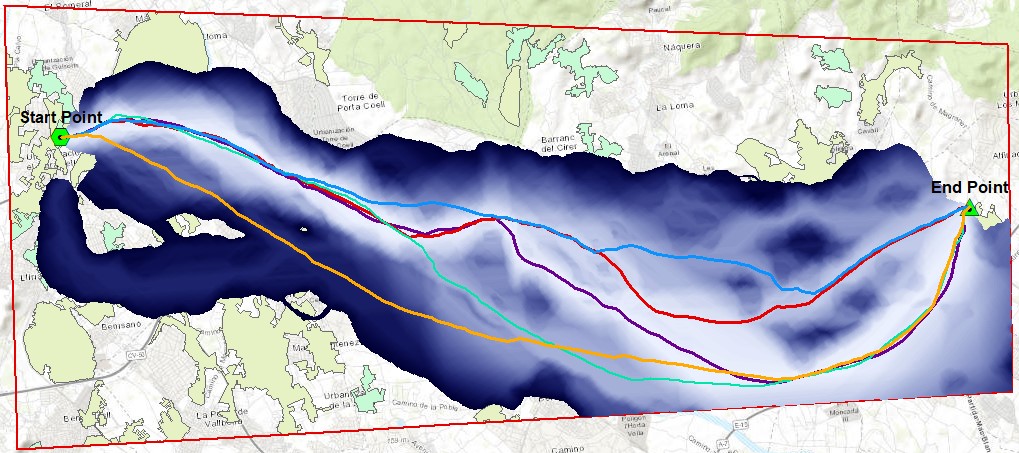
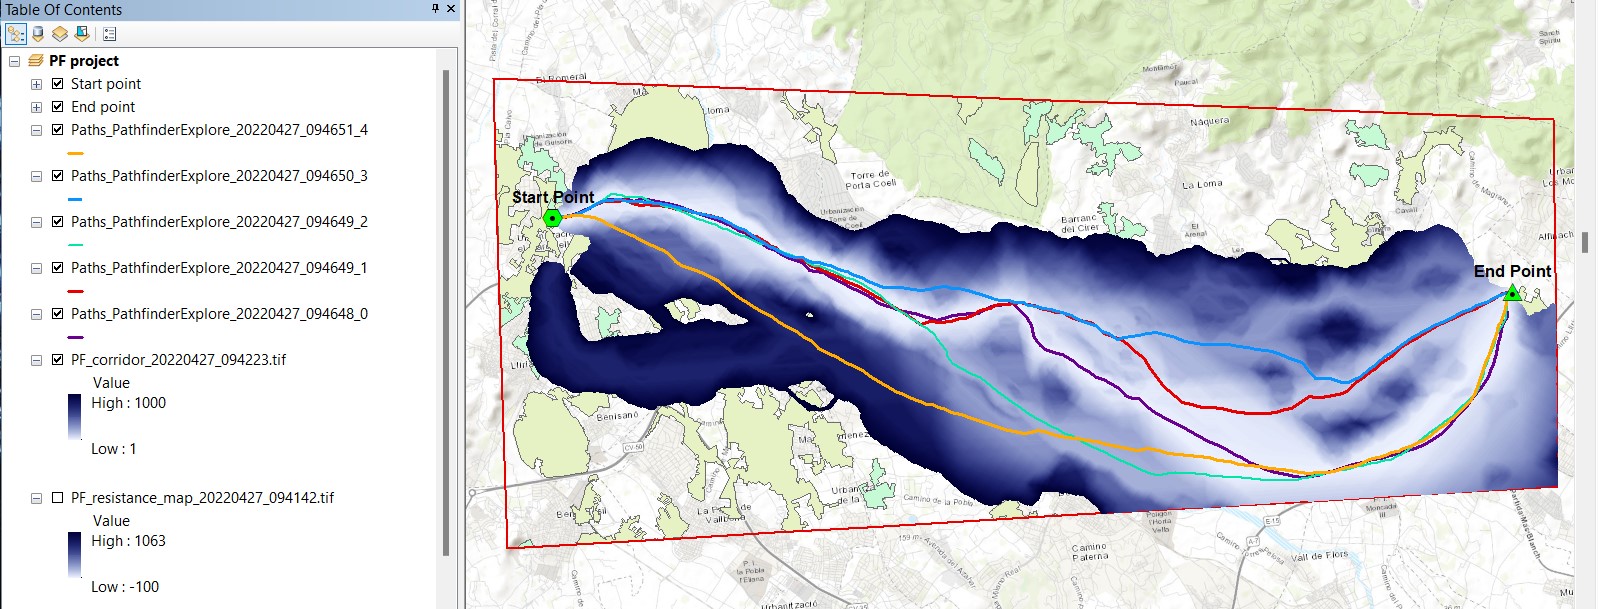
Pathfinder Explore: it returns multiple path results, providing more alternative solutions.
When the Pylon Spotting or Pathfinder Explore algorithms are selected, the user can set additional parameters:
Edge weight (0.0 to 1.0): relative importance of the resistance along the line compared to the resistance at pylon locations. A value of 0.0 means that only the resistance at the pylon locations is important for the route optimization, 0.5 means both are equally important and if 1.0 is set, only the values along the line are important. By default, the value is 0.4.
Angle weight: relative importance of the path angles in the optimization. By default, the value is 0. (0.0 means angles do not matter, 1.0 means only angles matter).
Forbidden crossing allowed: If selected, it is possible to cross forbidden areas if the vertices (pylons) are outside. It this option is disabled, it will not be possible to cross forbidden areas. By default, it is allowed.
In the pylon spotting algorithm, two more options are available:
Maximum direction deviation: maximum angular deviation from the start-to-end direction. The angle units are degrees. The default value is 90 degrees, because in this method the path can’t go backwards.
Maximum angle: the maximum angle change at any vertex. By default, the value is 180 degrees.
It is possible to specify the minimum and maximum separation between pylons in any of the algorithms. In the case of the pylon spotting algorithm, it is recommended that the maximum and minimum distance values are not far apart. In this way, the algorithm will run faster and use less memory.
After the path calculation process finishes, the paths will be added to the Map as line layers.
Calculate All
Instead of generating the Resistance Map, Corridor and Path(s) one by one, the user can generate them all together in sequence. This can be done by using the Calculate All option in the Results menu.
We can now input all the parameters in a single tool.
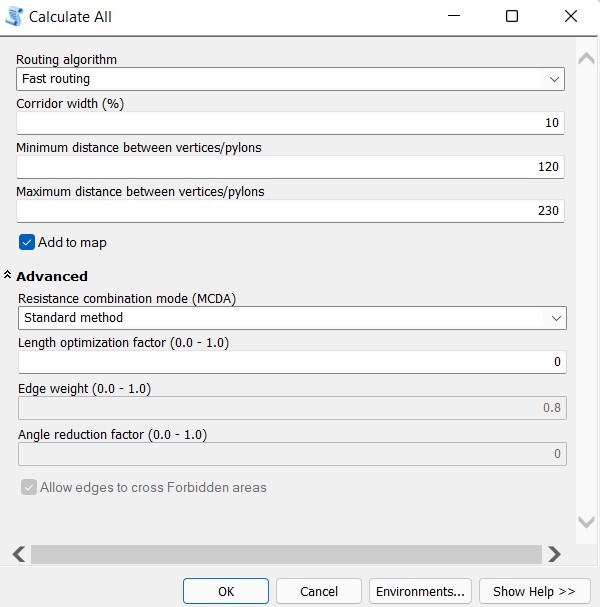
Notice that all the results are now generated by a single process and become visible in the Map after the process is complete.
Results folder
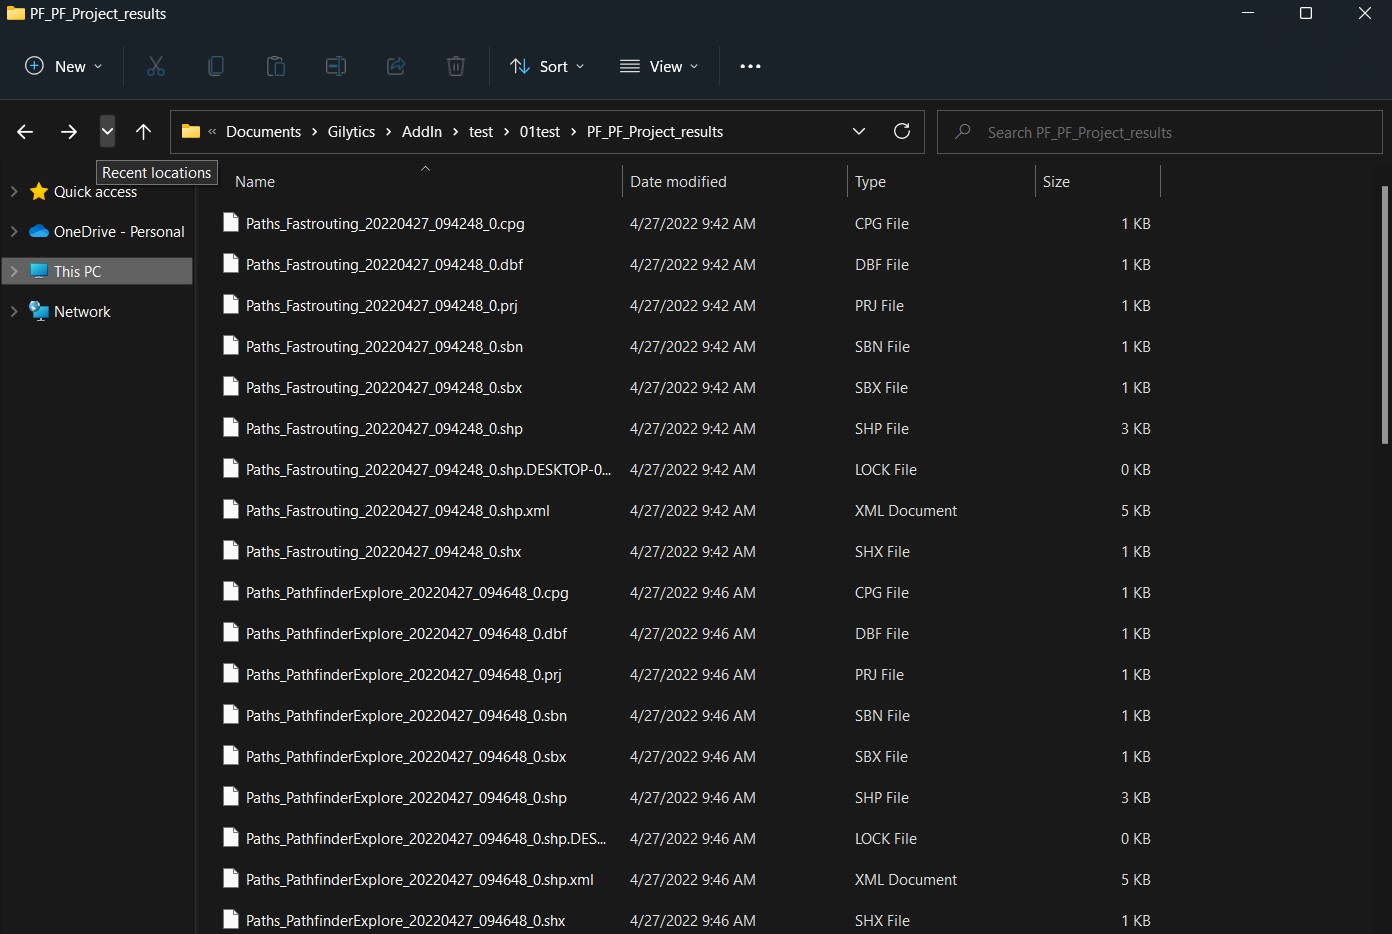
The calculated results are saved to a local disk folder with a time stamp in the file name, so multiple versions can be generated without overwriting each other.
With the Results folder menu option, the user can open the location of the result files to manage them. For instance, if some results were not added to the Map or have been removed from the project, they can be added later from this folder.
Note
If layer parameters like the ring/buffer sizes of resistances are changed, all the results should be recalculated to match these changes. If only the Start or End points are changed, it is not necessary to recalculate the Resistance Map.
Note
The results are stored in the results folder with a timestamp in the file name, showing when they were generated. If you want to keep a history of the parameters used to create each result, it is advisable to save CSV files with these parameters as well.
Disclaimer: the scenarios depicted in this manual do not represent actual customer projects or infrastructure proposals, and are presented for demonstration purposes only.
For more help, please contact Gilytics.